;%20}%20.cls-2%20{%20fill:%20%23e4e4e7;%20}%20%3c/style%3e%3clinearGradient%20id='linear-gradient'%20x1='80'%20y1='77.67'%20x2='80'%20y2='4.6'%20gradientUnits='userSpaceOnUse'%3e%3cstop%20offset='0'%20stop-color='%232962ff'/%3e%3cstop%20offset='1'%20stop-color='%235e8aff'/%3e%3c/linearGradient%3e%3c/defs%3e%3cpath%20class='cls-1'%20d='M122.39,5.7c.3-.6-.3-1.28-.98-1.06l-35.04,15-46.73,46.73c-2.26,2.26-2.64,5.05-1.51,7.54,1.06,1.88,3.01,3.77,6.03,3.77h42.81c.15,0,.25-.11.3-.23'/%3e%3cpath%20class='cls-2'%20d='M43.41,85.28c-6.03,0-10.55-3.77-12.81-9.04-2.26-5.28-.75-11.3,3.01-15.07l35.87-35.87c.45-.45.15-1.28-.53-1.28h-30.45c-.15,0-.3.08-.3.23L4,94.02c-.23.53.15,1.06.68,1.06h66.09c.15,0,.23-.08.3-.23l4.22-8.52c.23-.53-.15-1.06-.68-1.06,0,0-31.2,0-31.2,0Z'/%3e%3cg%3e%3cpath%20class='cls-2'%20d='M171.5,44.17h-12.1c0-9-5.1-13.6-14.3-13.6-7.7,0-12.5,3.7-12.5,9.5,0,6.5,4.9,8.5,16.3,11.3,13.4,3.3,24.6,6.8,24.6,21.8,0,13.2-10.6,21.8-26.6,21.8-17.2,0-27.7-8.7-27.7-25h12.3c0,10.2,5.6,15.1,15.5,15.1,8.9,0,14.1-4.1,14.1-10.8,0-7.2-5.2-8.8-16.1-11.5-13.5-3.4-24.7-6.7-24.7-21.6,0-12.1,9.9-20.4,25-20.4,17.3,0,26.2,8.1,26.2,23.4Z'/%3e%3cpath%20class='cls-2'%20d='M208.6,84.28v8.9c-1.7.5-4.3.9-6.4.9-10.7,0-15.4-4.5-15.4-15.6v-27.1h-8.5v-8.7h8.5v-12.7h11.4v12.7h9.9v8.7h-9.9v25.4c0,5.7,1.9,8,6.9,8,1.3,0,2.7-.2,3.5-.5Z'/%3e%3cpath%20class='cls-2'%20d='M263.2,68.08c0,16.5-9.6,26.9-25,26.9s-25.1-10.4-25.1-26.9,9.7-26.9,25.1-26.9,25,10.4,25,26.9ZM225.1,68.08c0,11,5,17.9,13.1,17.9s13.1-6.9,13.1-17.9-5-17.9-13.1-17.9-13.1,6.9-13.1,17.9Z'/%3e%3cpath%20class='cls-2'%20d='M320.2,61.08h-11.9c-.5-6.6-4.8-10.9-11-10.9-8,0-12.7,6.8-12.7,17.9s4.7,17.9,12.7,17.9c6.2,0,10.4-4.9,10.9-11.8h12c-1,12.3-9.8,20.8-22.9,20.8-15,0-24.7-10.4-24.7-26.9s9.7-26.9,24.7-26.9c13,0,21.9,8.3,22.9,19.9Z'/%3e%3cpath%20class='cls-2'%20d='M363.1,93.48l-19.8-24.6h-.2v24.6h-11.4V22.27h11.4v41.2h.2l18.5-20.8h13.3l-21,23.2,23.4,27.6h-14.4Z'/%3e%3c/g%3e%3cg%3e%3cpath%20class='cls-2'%20d='M433.3,83.08v10.4h-47V22.27h12v60.8h35Z'/%3e%3cpath%20class='cls-2'%20d='M476.4,78.18h11.7c-1.9,9.1-10.1,16.8-23.4,16.8-15.5,0-24.6-11.1-24.6-27.5,0-15,9-26.3,24.4-26.3,11.6,0,20,6.7,22.8,17.3,1,3.2,1.4,7,1.4,11.9h-37.3c.4,11.5,6.2,16.2,13.3,16.2,6.5,0,10.7-3.5,11.7-8.4ZM451.6,62.88h25.7c-.8-8.9-6-13.3-12.8-13.3s-11.9,4.5-12.9,13.3Z'/%3e%3cpath%20class='cls-2'%20d='M547.5,62.38v31.1h-11.4v-30.1c0-9.1-3.9-12.7-10.3-12.7s-11.6,4.9-11.6,14.6v28.2h-11.4v-50.8h10.8v6.6h.2c3.2-4.6,8.5-7.8,15.2-7.8,11.5,0,18.5,7,18.5,20.9Z'/%3e%3cpath%20class='cls-2'%20d='M602.2,58.48h-11c0-6.1-3.6-9-9.7-9-5.3,0-8.4,2.3-8.4,6,0,4.4,3.5,5.3,11.5,7.3,9.3,2.4,19.2,4.6,19.2,16.7,0,9.2-8.2,15.5-21.3,15.5s-21.9-6.1-22-18.2h11.6c0,6.2,3.8,9.7,10.6,9.7,5.8,0,9.2-2.5,9.2-6.3,0-5.2-4-6.2-12.8-8.4-8.5-2.1-17.4-4-17.4-15.4,0-9,8-15.2,19.9-15.2,12.9,0,20.5,6,20.6,17.3Z'/%3e%3c/g%3e%3c/svg%3e)
Brink’s (BCO): US$6.6 Billion ATM Deal Turns Cash Generation Into Debt Defense
By StockLens
September 10, 2026
4 min read
A synthesis of StockLens's multi-domain algorithmic analysis.
The Brink's Company
Source as of September 10, 2026
Core Tension
Piotroski F-Score: No rule defined for this metric
Current Ratio: Mitigated: Strong liquidity: Quick Ratio > 0.9
Interest Coverage: Mitigated: Strong cash interest service: operating cash flow covers interest expense more than an adjustment with positive free cash flow
Debt-to-Equity: Neither strong interest coverage nor strong cash flow to debt ratio detected
Domain Read
Strengths
Constructive enough to anchor part of the thesis.
Constructive enough to anchor part of the thesis.
Challenges
Keeps the thesis from reading as one-directional.
Keeps the thesis from reading as one-directional.
Uncertainty
Sentiment carries lower confidence than the headline read.
Key Takeaways
- AMS and DRS organic revenue expanded 14% in Q2 2026, doubling the 7% total revenue growth rate and marking a fourteenth consecutive quarter of mid-teens-or-better expansion in strategic service lines.
- The Malaysia de-consolidation removes approximately US$100 million in four-quarter revenue while reducing adjusted EBITDA by only US$10 million to US$15 million, reflecting underlying margin resilience.
- Free cash flow growth of 13.2% outstripped 8.1% revenue growth, establishing vital cash momentum as forward revenue growth slows to 3.6% ahead of the Atleos integration.
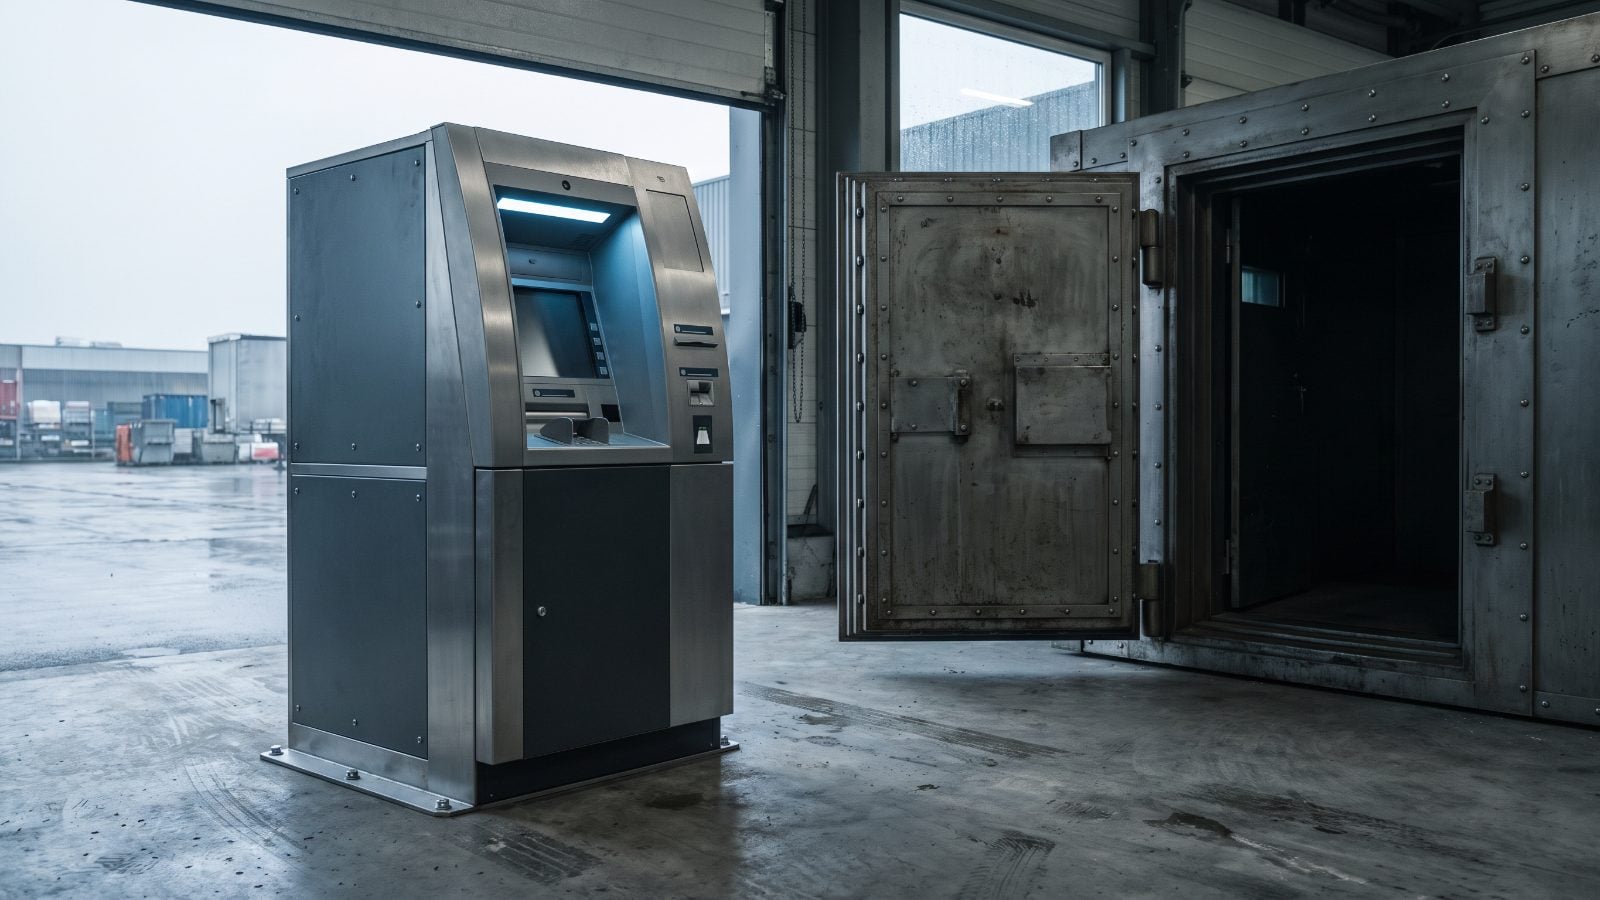
On February 26, 2026, The Brink’s Company (BCO) agreed to acquire NCR Atleos for US$6.6 billion, accelerating its shift toward managed ATM services while placing balance-sheet defense directly on cash conversion. Existing holders are counting on managed-services expansion, margin gains, and US$200 million of targeted annual run-rate cost synergies within three years to support the acquisition financing without compromising financial flexibility.
Managed Services Must Earn Their Financing
Brink’s plans to combine its global cash-logistics infrastructure with approximately 78,000 owned-and-operated NCR Atleos ATMs and a broader installed base of 600,000 machines. While mature cash-logistics volumes remain comparatively restrained, Q2 2026 operating results reported August 5 demonstrated operating traction in the faster-growing mix. Revenue grew 7% year over year, while AMS and DRS organic revenue expanded 14%, extending their run to a fourteenth consecutive quarter of mid-teens-or-better growth. Adjusted EBITDA rose 11% to US$257.2 million, delivering an 18.5% margin.
A July 24, 2026, disclosure confirmed that the Malaysia de-consolidation will reduce reported revenue by approximately US$100 million across four quarters while reducing adjusted EBITDA by only US$10 million to US$15 million, preserving management’s organic-growth and margin-expansion framework.
Shareholders approved the transaction on June 30, 2026, and U.S. antitrust clearance positions the deal to close by the end of Q1 2027, leaving Brink’s shareholders with approximately 78% ownership. Securing the network requires a US$2.2 billion cash outlay and the assumption of approximately US$2.6 billion of Atleos debt, supported by committed bridge financing and an expanded US$3.85 billion credit facility through 2031. Set against those upfront financial commitments, the US$200 million of targeted annual run-rate cost synergies will take three years to materialize fully. Because synergy delivery is gradual, ongoing mid-teens organic growth in managed services and steady margin expansion must shoulder the immediate financing burden from day one.
Cash Generation Has Less Room for Error
Per StockLens’s model, as of September 10, 2026, Brink’s carries a Composite score of 76 and a Solid rating. Its 8.79% FCF Yield places it in the top quintile of its peer set, while 13.2% FCF Growth outpaced its 8.1% Revenue Growth. That cash momentum stands against clear balance-sheet constraints: Debt-to-Equity of 9.59 sits in the higher-risk half of peers, while a 3.3% Net Profit Margin and 2.5% Return on Assets remain in the lower half. Furthermore, Forward Revenue Growth of 3.6% trails recent top-line velocity, leaving a narrow operational margin beneath the larger debt load.
Management’s full-year 2026 targets of 40% to 45% free-cash-flow conversion and 30 to 50 basis points of adjusted EBITDA margin expansion define the operating support required by the capital structure. These serve as corporate benchmarks rather than confirmed results.
The United States monetary policy stance classification of Tightening dated September 10, 2026, the 10-Year Government Yield of 4.80% observed September 8, 2026, and the Fed Funds Rate of 3.63% observed August 1, 2026, frame the refinancing backdrop. A tighter funding environment raises the execution hurdle for de-leveraging, ensuring debt service depends on internal cash generation rather than cheap debt rollover.
How the Same Evidence Changes by Investor Lens
Show the underlying values
| Horizon | Focus | Composite Score | Grade |
|---|---|---|---|
| Short-term (2 wks) | Defensive | 75 | Bullish |
| Short-term (2 wks) | Balanced | 75 | Bullish |
| Short-term (2 wks) | Growth | 76 | Bullish |
| Medium-term (1 mo) | Defensive | 76 | Bullish |
| Medium-term (1 mo) | Balanced | 76 | Bullish |
| Medium-term (1 mo) | Growth | 77 | Bullish |
| Long-term (1 yr) | Defensive | 79 | Bullish |
| Long-term (1 yr) | Balanced | 80 | Bullish |
| Long-term (1 yr) | Growth | 80 | Bullish |
Display-safe approximation: each cell re-weights the same calibrated per-domain scores by that evidence-history/analysis-focus profile's composite weights. It re-combines published domain scores; it is not a re-run of the engine. Treat each composite as directional, not precise, and not as a personalized suitability assessment or forecast.
What Changes the View
Closing on the guided timetable represents the initial hurdle; any regulatory or procedural delay would postpone network combination and synergy realization.
AMS and DRS sustaining mid-to-high-teens organic growth alongside continued adjusted EBITDA margin expansion would validate the strategic rationale. Slower managed-services growth or integration expenses overwhelming projected synergies would weaken it.
Free-cash-flow conversion meeting management's 40% to 45% framework and verified synergy delivery funding debt reduction would confirm the cash buffer is holding. Deteriorating conversion or persistently elevated leverage without a clear reduction trajectory would challenge the view.
How StockLens scores: every company is scored by the same quantitative engine across five domains (Fundamental, Technical, Risk, Sentiment, Macro), combined into one composite and read through the archetype lens that fits its business model. When the engine sets a metric aside, that abstention is deliberate rigor, not missing analysis.
This is not investment advice; it is an algorithmically generated analysis produced by StockLens's quantitative and agentic AI models.
Sources
Scores and grades reflect StockLens's proprietary model, as of September 10, 2026. External facts referenced above are grounded in the following public sources.
- VIX (equity volatility), observed 2026-09-09
- 10-Year Government Yield, observed 2026-09-08
- 2-Year Government Yield, observed 2026-09-08
- CPI (year-over-year change), observed 2026-07-01
- Fed Funds Rate, observed 2026-08-01
- CAPE (Shiller P/E), observed 2026-09-01
- Baa-to-Aaa Credit Spread, observed 2026-09-08
- marketbeat.com
- tradingkey.com
- investing.com
- brinks.com
- simplywall.st
- tradingview.com
- stocktitan.net
- benzinga.com
- csimarket.com
- owler.com
- loomis.com
- tracxn.com
- finsee.ai
- alphaspread.com
- brinks-ams.com
- sec.gov
- umbrex.com
- thepaypers.com
- ncratleos.com
- businesswire.com
- minichart.com.sg