;%20}%20.cls-2%20{%20fill:%20%23e4e4e7;%20}%20%3c/style%3e%3clinearGradient%20id='linear-gradient'%20x1='80'%20y1='77.67'%20x2='80'%20y2='4.6'%20gradientUnits='userSpaceOnUse'%3e%3cstop%20offset='0'%20stop-color='%232962ff'/%3e%3cstop%20offset='1'%20stop-color='%235e8aff'/%3e%3c/linearGradient%3e%3c/defs%3e%3cpath%20class='cls-1'%20d='M122.39,5.7c.3-.6-.3-1.28-.98-1.06l-35.04,15-46.73,46.73c-2.26,2.26-2.64,5.05-1.51,7.54,1.06,1.88,3.01,3.77,6.03,3.77h42.81c.15,0,.25-.11.3-.23'/%3e%3cpath%20class='cls-2'%20d='M43.41,85.28c-6.03,0-10.55-3.77-12.81-9.04-2.26-5.28-.75-11.3,3.01-15.07l35.87-35.87c.45-.45.15-1.28-.53-1.28h-30.45c-.15,0-.3.08-.3.23L4,94.02c-.23.53.15,1.06.68,1.06h66.09c.15,0,.23-.08.3-.23l4.22-8.52c.23-.53-.15-1.06-.68-1.06,0,0-31.2,0-31.2,0Z'/%3e%3cg%3e%3cpath%20class='cls-2'%20d='M171.5,44.17h-12.1c0-9-5.1-13.6-14.3-13.6-7.7,0-12.5,3.7-12.5,9.5,0,6.5,4.9,8.5,16.3,11.3,13.4,3.3,24.6,6.8,24.6,21.8,0,13.2-10.6,21.8-26.6,21.8-17.2,0-27.7-8.7-27.7-25h12.3c0,10.2,5.6,15.1,15.5,15.1,8.9,0,14.1-4.1,14.1-10.8,0-7.2-5.2-8.8-16.1-11.5-13.5-3.4-24.7-6.7-24.7-21.6,0-12.1,9.9-20.4,25-20.4,17.3,0,26.2,8.1,26.2,23.4Z'/%3e%3cpath%20class='cls-2'%20d='M208.6,84.28v8.9c-1.7.5-4.3.9-6.4.9-10.7,0-15.4-4.5-15.4-15.6v-27.1h-8.5v-8.7h8.5v-12.7h11.4v12.7h9.9v8.7h-9.9v25.4c0,5.7,1.9,8,6.9,8,1.3,0,2.7-.2,3.5-.5Z'/%3e%3cpath%20class='cls-2'%20d='M263.2,68.08c0,16.5-9.6,26.9-25,26.9s-25.1-10.4-25.1-26.9,9.7-26.9,25.1-26.9,25,10.4,25,26.9ZM225.1,68.08c0,11,5,17.9,13.1,17.9s13.1-6.9,13.1-17.9-5-17.9-13.1-17.9-13.1,6.9-13.1,17.9Z'/%3e%3cpath%20class='cls-2'%20d='M320.2,61.08h-11.9c-.5-6.6-4.8-10.9-11-10.9-8,0-12.7,6.8-12.7,17.9s4.7,17.9,12.7,17.9c6.2,0,10.4-4.9,10.9-11.8h12c-1,12.3-9.8,20.8-22.9,20.8-15,0-24.7-10.4-24.7-26.9s9.7-26.9,24.7-26.9c13,0,21.9,8.3,22.9,19.9Z'/%3e%3cpath%20class='cls-2'%20d='M363.1,93.48l-19.8-24.6h-.2v24.6h-11.4V22.27h11.4v41.2h.2l18.5-20.8h13.3l-21,23.2,23.4,27.6h-14.4Z'/%3e%3c/g%3e%3cg%3e%3cpath%20class='cls-2'%20d='M433.3,83.08v10.4h-47V22.27h12v60.8h35Z'/%3e%3cpath%20class='cls-2'%20d='M476.4,78.18h11.7c-1.9,9.1-10.1,16.8-23.4,16.8-15.5,0-24.6-11.1-24.6-27.5,0-15,9-26.3,24.4-26.3,11.6,0,20,6.7,22.8,17.3,1,3.2,1.4,7,1.4,11.9h-37.3c.4,11.5,6.2,16.2,13.3,16.2,6.5,0,10.7-3.5,11.7-8.4ZM451.6,62.88h25.7c-.8-8.9-6-13.3-12.8-13.3s-11.9,4.5-12.9,13.3Z'/%3e%3cpath%20class='cls-2'%20d='M547.5,62.38v31.1h-11.4v-30.1c0-9.1-3.9-12.7-10.3-12.7s-11.6,4.9-11.6,14.6v28.2h-11.4v-50.8h10.8v6.6h.2c3.2-4.6,8.5-7.8,15.2-7.8,11.5,0,18.5,7,18.5,20.9Z'/%3e%3cpath%20class='cls-2'%20d='M602.2,58.48h-11c0-6.1-3.6-9-9.7-9-5.3,0-8.4,2.3-8.4,6,0,4.4,3.5,5.3,11.5,7.3,9.3,2.4,19.2,4.6,19.2,16.7,0,9.2-8.2,15.5-21.3,15.5s-21.9-6.1-22-18.2h11.6c0,6.2,3.8,9.7,10.6,9.7,5.8,0,9.2-2.5,9.2-6.3,0-5.2-4-6.2-12.8-8.4-8.5-2.1-17.4-4-17.4-15.4,0-9,8-15.2,19.9-15.2,12.9,0,20.5,6,20.6,17.3Z'/%3e%3c/g%3e%3c/svg%3e)
TTM Technologies (TTMI): Epiq Debt Arrives Without Positive Free Cash Flow
By StockLens
September 23, 2026
4 min read
A synthesis of StockLens's multi-domain algorithmic analysis.
TTM Technologies, Inc.
Source as of September 23, 2026
Domain Read
Key Takeaways
- Management raised full-year 2026 base-business guidance to approximately US$4.4 billion in sales, explicitly excluding pending Epiq, STG, and ILFA acquisitions and confirming that current demand does not rely on acquired volume 2.
- Record second-quarter 2026 sales sit beside negative free cash flow across both first-half 2026 and aligned trailing-twelve-month periods, meaning top-line momentum has not yet produced positive cash generation 2, 4, 1.
- Reported third-quarter sales delivery, realized cash conversion, Epiq closing milestones, and subsequent credit rating actions are the observable conditions that would alter this view 2, 3, 4.
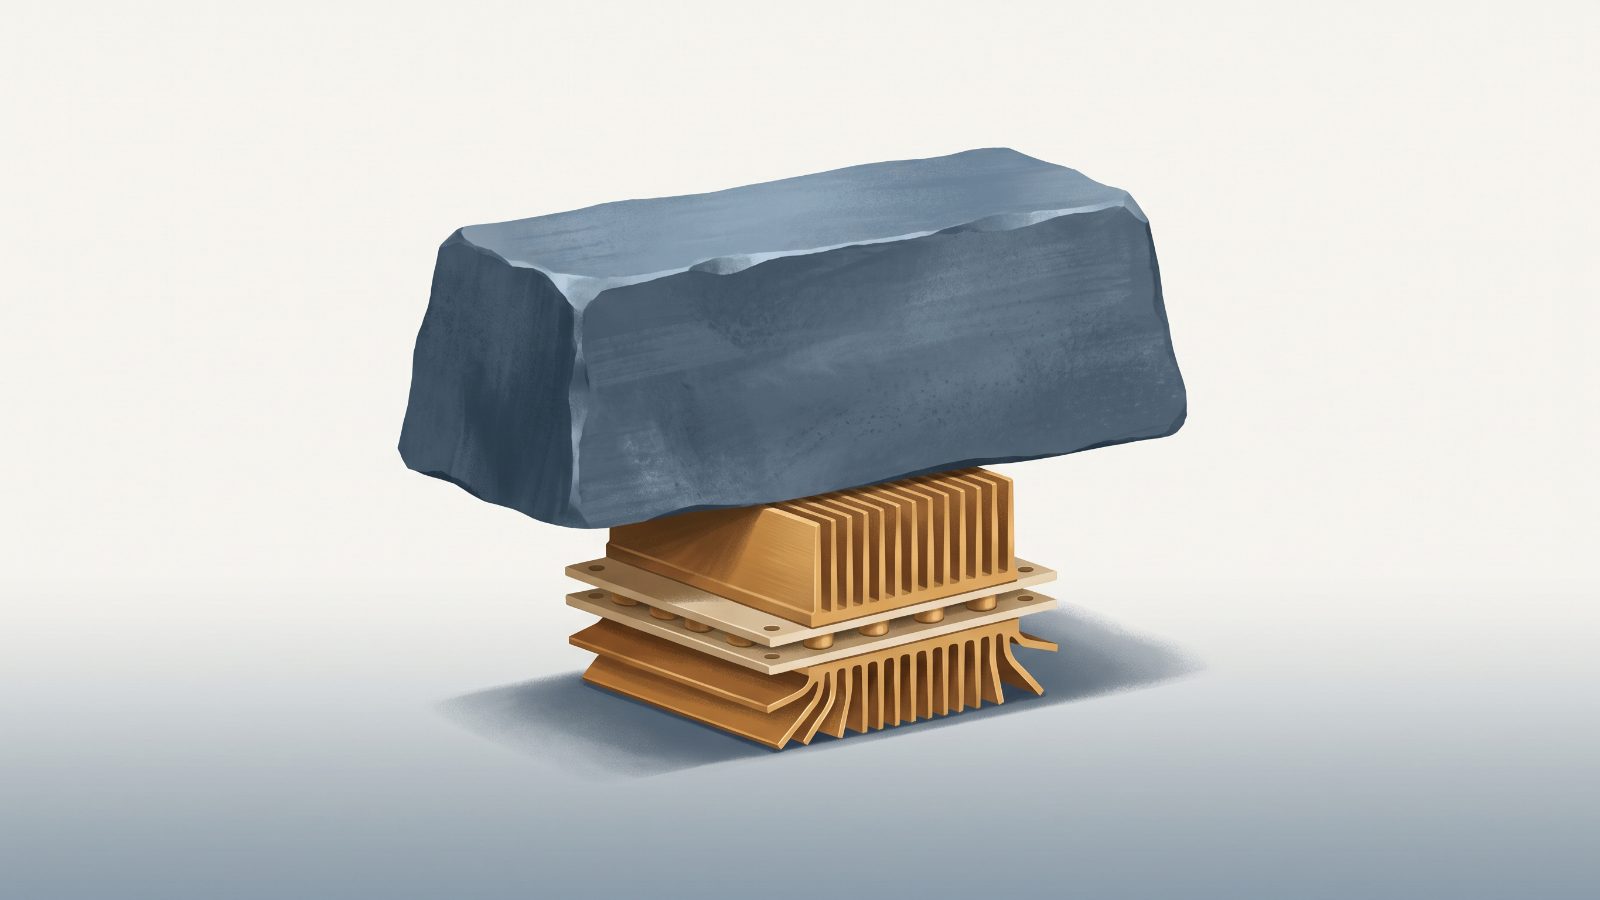
TTM Technologies (TTMI) agreed on August 17, 2026, to acquire Epiq Solutions for approximately US$1.1 billion in cash and issued US$500 million of 6.750% senior notes due 2034 on September 10, even as free cash flow remained negative across both first-half 2026 and aligned trailing-twelve-month measurements 2, 4, 1. For investors, cash conversion is the critical link: accelerating base-business demand matters only if it expands the company's capacity to absorb the transaction and service the added debt.
Demand Is Expanding Before the Acquisitions Arrive
TTM reported second-quarter 2026 net sales of US$1.00 billion, up 37.4% from the second quarter of 2025, led by 91% year-over-year growth in Data Center and Networking 2. A companywide book-to-bill ratio of 1.49 pointed to continued order intake ahead of billed revenue 2.
Management raised full-year 2026 base-business guidance to approximately US$4.4 billion in sales and nearly US$5.00 in non-GAAP EPS, excluding pending acquisitions of Epiq, STG, and ILFA 2. These figures represent forward guidance rather than reported results; their analytical importance lies in their perimeter, demonstrating that underlying operational momentum is expanding independently of transaction contributions.
Sales Momentum Has Not Yet Become Free Cash Flow
On an aligned trailing-twelve-month basis, TTM generated US$322.91 million in operating cash flow against US$338.04 million in capital expenditure, producing negative free cash flow of US$15.14 million 1. Over the first half of 2026, free cash flow was negative US$39.0 million 4. Covering different reporting horizons, these figures represent distinct measurements rather than a continuous sequence, but both show that ongoing operations have not self-funded capital requirements.
The September 10, 2026 issuance of US$500 million in 6.750% senior notes due 2034 adds fixed carrying costs directly on top of that deficit to support the US$1.1 billion cash purchase of Epiq 4. Credit rating agencies reflect this tension: S&P affirmed its BB issuer rating but adjusted its outlook to stable from positive to account for debt financing, while Moody's maintained Ba2 and upgraded its outlook to positive from stable, citing AI-driven volume expansion 3. Neither agency action resolves TTM's post-closing cash capacity.
The Strongest Case for Cash Catching Up
The strongest counterweight to this concern is that TTM's operational acceleration is substantial, organic, and established prior to any acquired contribution 2. With second-quarter net sales reaching a record US$1.00 billion and a 1.49 book-to-bill ratio, the base business shows significant operating leverage. If that shipment volume converts into cash faster than capital expenditure and working capital consume it, the current deficits will prove transitional, supplying internal liquidity to service debt and integrate Epiq smoothly. To substantiate that countercase, however, operating momentum must yield sustained positive free cash flow rather than remaining confined to accounting revenue and non-GAAP earnings.
What the Growth Reading Adds
Per StockLens's model, as of September 23, 2026, TTM scores 86 on Growth 1. That Growth score captures top-quartile trailing-twelve-month revenue growth of 27.6% and top-quartile forward EPS growth expectations of 175.1% 1. The factor evaluation explicitly mitigates the negative free-cash-flow factor, recognizing that heavy capital expenditure and working-capital demands reflect investments to meet customer schedules rather than structural operational decay 1. Yet that mitigation provides operational context, not financial proof: it explains why capital is currently deployed, but leaves execution, cash returns, and post-close debt service unresolved.
What Changes the View
- Sales delivery: Reported third-quarter 2026 base-business sales meeting or exceeding management's guidance range of US$1.10 billion to US$1.14 billion on the same reported-versus-guidance basis 2.
- Cash conversion: Delivery of positive free cash flow after capital expenditures and working-capital outlays, reported on a clearly specified quarterly, first-half, or trailing-twelve-month basis, demonstrating that volume growth is generating positive cash flow 4, 1.
- Transaction completion: Regulatory approval and formal closing of the Epiq acquisition in the fourth quarter of 2026, satisfying note covenants ahead of the November 15, 2026 mandatory redemption deadline or within an extension through May 15, 2027 2, 4.
- Credit evidence: Subsequent rating or outlook adjustments from S&P or Moody's, alongside reported post-transaction debt-service capacity showing the balance sheet can absorb the increased leverage 3.
How StockLens scores: every company is scored by the same quantitative engine across five domains (Fundamental, Technical, Risk, Sentiment, Macro), combined into one composite and read through the archetype lens that fits its business model. When the engine sets a metric aside, that abstention is deliberate rigor, not missing analysis.
This is not investment advice; it is an algorithmically generated analysis produced by StockLens's quantitative and agentic AI models.
Sources
Scores and grades reflect StockLens's proprietary model, as of September 23, 2026.
How StockLens reads TTM Technologies, Inc.
Core Tension
Interest Coverage: Mitigated: Strong interest service capability: EBITDA to Interest Expense Ratio > 4.0
Current Ratio: Mitigated: Strong liquidity: Quick Ratio > 0.9
Debt-to-Equity: Mitigated: Strong debt service capability: Interest Coverage Ratio > 3.0
Sloan Ratio: Mitigated: Conservative accounting: Negative Sloan Ratio AND Income Quality > 1.0
Uncertainty
Sentiment carries lower confidence than the headline read.
Analyze TTMI in StockLens
Run a fresh StockLens analysis of TTM Technologies, Inc. (TTMI).